Tips for Using a Workday Dashboard
Before you begin
Dashboards in Workday, termed in Workday as "Custom Landing Page Group", is a collection of reports. A dashboard may have multiple tabs, and each tab can have up to 6 worklets. A worklet is a mini version of a report, and can contain a number of different components:
Graph
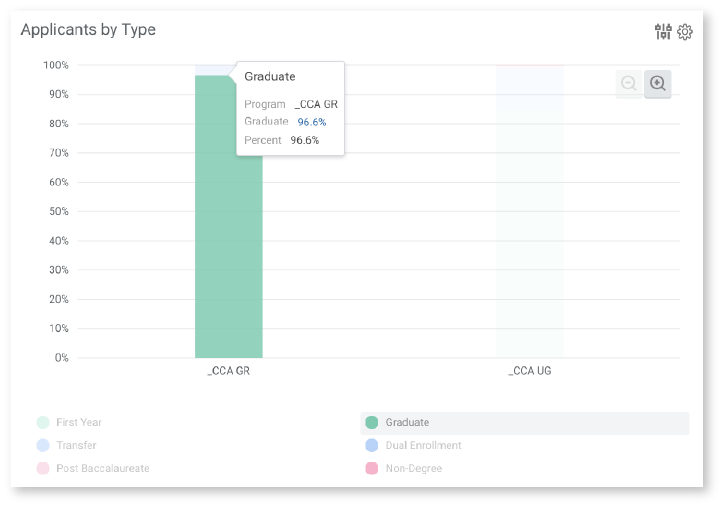
Many worklets contain a prominent chart element that summarizes table data visually.
Click or hover over a variable in the chart legend to highlight that particular portion of chart data.
Hover over a bar, slice, or data point to highlight it and see a “summary” of its exact value, variable, and/or category (as designated in the chart legend).
Click on a bar/slice/data point to pull up a menu showing the available ways to view that data selection in detail.
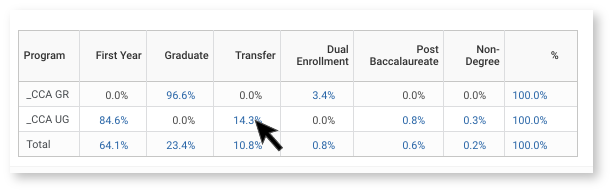
Data Table
A data table displays beneath the worklet graph (the graph is based on this data). To sort and/or apply data filters, click on the column header you’d like to sort by or apply a filter to.
Sort
You can Sort Ascending (lower numbers on top) or Sort Descending (higher numbers on top).
Filter
A filter consists of two parts:
1) A Filter Condition, or a logical operator, such as:
- Equal to (=)
- Not equal to (<>)
- Greater than or equal to (>=)
- Less than or equal to (<=)
- Between
- Is empty
2) A Value for comparison (using the selected logical operator)
For example, if you only want to view details for the Film Program, you would apply a filter for Academic Unit, selecting “=” for your Filter Condition and “3” for your Value.
Once these fields are set, click the orange Filter button to apply the filter.
Remove Sorting/Filters
You can remove filters and sorting by clicking the column header and clicking Remove Sort and/or Remove Filter.

Full Report View
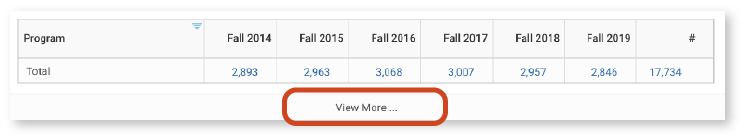
At the bottom of each worklet is a View More… button, which opens a more detailed, full-screen view of the worklet report. The full report view features additional data filters and a larger, more legible chart.
After clicking View More… you may first be prompted to confirm/adjust the filters. Then click OK to proceed.
Worklet Settings
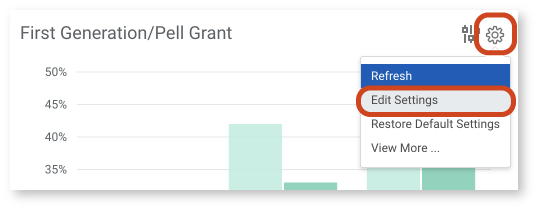
The gear icon in the upper right-hand corner of each worklet controls display settings. The options available will differ for each worklet.
In many cases, choosing "Edit Settings" will enable you to filter the data you are viewing in the worklet.
Data Drill Down
Sometimes, you may want to know more details about a particular piece of data in a Workday worklet. Most worklet data points display in blue, indicating that you can click on the field to view details not otherwise shown in the basic worklet view. Drilling down on individual data points can help you identify additional patterns (or differences) not otherwise apparent from the standard worklet view. You can drill down on specific table or chart data.
Click one of the blue numbers in a worklet table to bring up a popup window displaying another data table. You can also click a data point or section of the chart to pull up a menu of options.
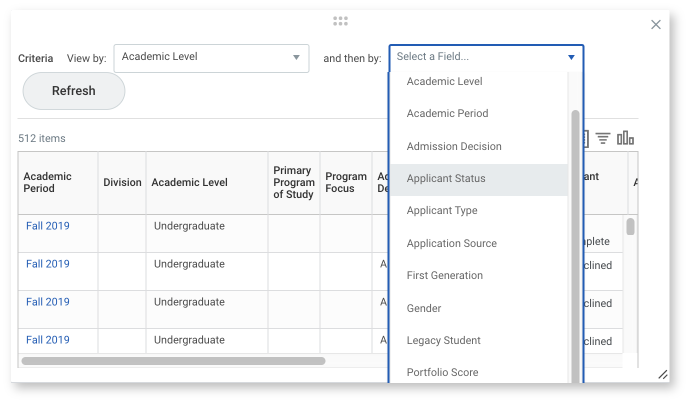
Summarize Drill Down Details
After drilling down into a detail view of a particular data point, you'll find two Criteria fields at the top of the screen. These fields can be used to summarize the data by different fields. The first field selection, “View by,” determines the leftmost table column(s). The second field selection, “and then by,” determines the column(s) to the right. Click the Refresh button to display any changes to these fields.